
|
Hints & ExamplesHints on how to use AIOMFAC-web ↑TopRead the following descriptions to learn more about the use of AIOMFAC-web, the types of calculations that can be done, the interpretation of model results, and how to deal with error messages. What AIOMFAC-web can compute ↑TopActivity coefficientsAIOMFAC is a thermodynamic model designed to calculate the non-ideal mixing behavior in liquid or liquid-like viscous solutions, expressed in terms of activity coefficients (About AIOMFAC). Therefore, the main results of an AIOMFAC-web computation are the activity coefficients, γj, of the chemical species, j, as a function of mixture composition and temperature T (the inputs). In mathematical terms: γj = f (T, x1, x2, ..., xj, ..., xk-1) for a system of k components, where the function f represents the AIOMFAC model and the composition is expressed in mole fractions xj. Mixture viscosity prediction with AIOMFAC-VISCStarting with AIOMFAC-web v2.30 and more recent versions, the model has been extended to provide predictions of the dynamic viscosity of aqueous organic mixtures in parallel to activity coefficients based on the work by Gervasi et al. (2020). However, prior to version 3, those predictions did not support systems/phases containing electrolytes. Starting with the introduction of AIOMFAC-web v3.01, an extended version of AIOMFAC-VISC has been implemented, which enables calculations of the viscosity of aqueous phases containing dissolved ions as well as the more general case of organic–inorganic mixtures based on the work by Lilek and Zuend (2022). The viscosity prediction involves the AIOMFAC-VISC group-contribution model described in detail in the studies by Gervasi et al. (2020) (original version) and Lilek and Zuend (2022) (extended version incl. electrolytes). With the use of AIOMFAC-VISC, the AIOMFAC-web model output includes a table listing the dynamic viscosity in the form of its base-10 logarithm as well as an estimation of its sensitivity/uncertainty on log-scale. We note that the prediction of viscosity is uncertain for two main reasons: (1) a relatively simple, temperature-dependent pure-component viscosity estimation for organic compounds is employed, at present based on the method of DeRieux et al. (2018); (2) uncertainty also arises from an incomplete capturing of non-linear mixing effects on viscosity, which are inherent to a group-contribution treatment of physicochemical interactions. The viscosity sensitivity column of the output table quantifies the estimated uncertainty, i.e. the ±log10(η) value corresponding to the listed log10 of viscosity for a specific solution. The sensitivity values are calculated by AIOMFAC-VISC assuming an arbitrary (but reasonable) uncertainty in the actual mixture composition introduced via a 2 % perturbation of the mass of component 1 (which is water when water is present) relative to the total mass of the mixture (details are provided in section S3 of the supplementary information to the article by Gervasi et al., 2020). As discussed in that article, the prediction of mixture viscosity with AIOMFAC-VISC can be improved when the pure component viscosities of involved organic compounds are known at the temperatures of interest – or when they can be inferred from accurate experimental data. However, such data are limited to a subset of specific systems (and can be done with our offline model version for such cases). For the purpose of predictability targeting a wide range of systems, including typical aerosol constituents, we use the broadly applicable method by DeRieux et al. with the online model. By default, the viscosity of mixed organic–inorganic phases is estimated by the Single-phase computation vs. equilibrium stateIt is important to note that AIOMFAC-web performs calculations of activity coefficients assuming a single mixed phase given by the stated composition – the model does not calculate thermodynamic phase equilibria or liquid–liquid phase separations on its own. To compute the number and compositions of stable phases at thermodynamic equilibrium based on AIOMFAC, an equilibrium model such as the one developed by Zuend et al. has to be employed (Zuend et al., 2010; 2011; Zuend and Seinfeld, 2012; 2013). Hence, AIOMFAC (and AIOMFAC-web) only solves for activity coefficients in individual liquid phases, for which the compositions are given by the user or determined by a thermodynamic equilibrium model. However, since thermodynamic equilibrium models rely on a global minimization of Gibbs free energy, which depends on activity coefficients, models such as AIOMFAC are a main component of any equilibrium approach involving liquid mixtures (Zuend et al., 2011). Keeping in mind that AIOMFAC-web just calculates the activity coefficients for whatever system is input by the user, the resulting activity coefficients (and activities) may or may not represent the values the system would exhibit at thermodynamic equilibrium. Within a liquid phase, the temperature-dependent bisulfate–sulfate dissociation equilibrium (HSO4- ⇌ H+ + SO42-) is solved explicitly while performing activity coefficient calculations (Zuend et al., 2011). However, if the system would undergo liquid–liquid phase separation or form solid phases in equilibrium with a saturated solution, the actual activity coefficients would be different from a single-phase calculation, since the composition of the considered phase(s) would change. Therefore, under certain conditions the AIOMFAC-web calculations will represent the solution of a metastable or unstable liquid system. Sometimes computations referring to metastable solutions are intended, e.g., when calculating activities in metastable, supersaturated electrolyte solutions representing the dehydration branch of a humidity cycle (e.g., of electrodynamic balance experiments) towards the crystallization (efflorescence) of an inorganic salt. Concerning organic compound activities, a mole fraction-based activity a(x) > 1 indicates that the pure component would be more stable than the compound in the mixture, so that in reality the mixture would undergo phase separation (at the latest at this point, but in partially miscible multicomponent systems often already at a(x) < 1). In case of organic components and water, activity coefficients γ(x) >> 1 are typically also an indicator for metastable / unstable conditions with respect to a liquid–liquid phase separation. However, the exact compositions and activity coefficient values at which a phase separation will occur depend on the defined system. An accurate prediction of a liquid–liquid equilibrium requires finding the global minimum in Gibbs energy, either with a direct global optimization method (e.g., Zuend et al., 2010) or, more efficiently, by solving a system of nonlinear equations in conjunction with Gibbs energy minimization (e.g., Zuend and Seinfeld, 2013). Such a prediction is computationally expensive, especially regarding multicomponent systems, and currently not made available as an online-tool. If you would like to perform such equilibrium computations based on AIOMFAC, consider contacting the authors for a potential scientific collaboration. Component and data limitsAIOMFAC-web is currently set up to allow up to 40 different system components and up to 101 data points for each model run. Besides organic–inorganic mixtures, one can of course also define pure aqueous electrolyte solutions or electrolyte-free organic mixtures. How to fill out the input form ↑TopTo run the AIOMFAC-web model one has to specify the system for which computations are requested. This involves two main parts: (i) defining the components of the system and (ii) stating the data points (temperature and composition) for which calculations should be performed. These specifications are made in the input form (Run Model), described in more detail below. Alternatively, one can also directly edit an input text-file saved from a previous session, e.g., to conveniently keep the system component definitions, but change the data points. In case an input file is edited, make sure to adhere to the format structure of the file. AIOMFAC-web input formFilling out the input form is intended to be straightforward. On the Run Model page just select and define one or several options at each subtitle position (step) of the form. The info buttons on the right side of each step provide additional information. For clarity, the different steps of the form are explained in a bit more detail here. 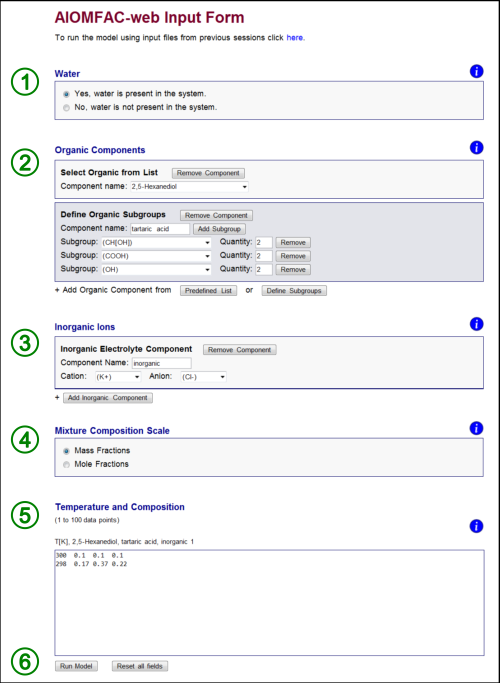
Fig. H1. AIOMFAC-web input form indicating the six steps of filling out the form (see text). In this example, a system consisting of the four components water, 2,5-hexanediol, tartaric acid, and KCl has been defined along with two data points (entered on two rows). Click here to display a larger version of this image.
Fig. H1 shows the input form – here filled out for a mixture containing both organic and inorganic species. The form is divided into six steps. The six steps required to complete the form and run AIOMFAC-web are:
Understanding the model output ↑TopFor the purpose of demonstration, we will discuss here the AIOMFAC-web output resulting from the input data shown in Fig. H1. The input file of this example can be downloaded from here (right click, "save linked content as"...), so that you can run the model with this input file to generate the output page, if you wish to do so. 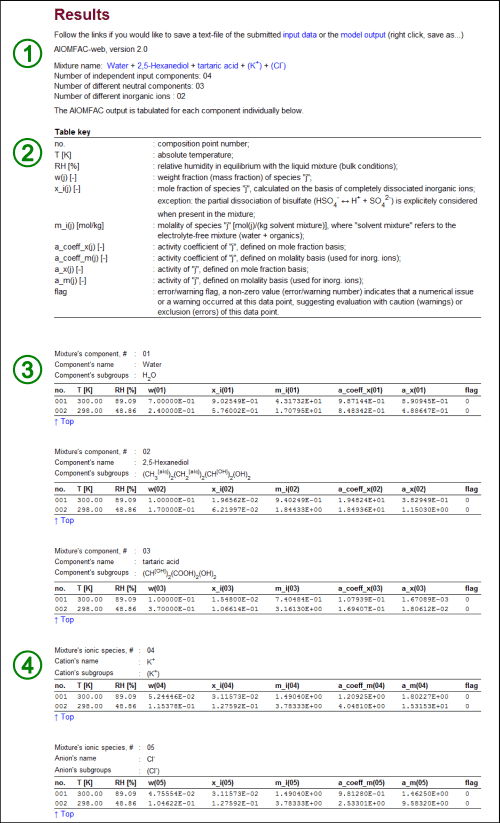
Fig. H2. AIOMFAC-web output. In this example, the results for the input from above (Fig. H1) are shown. The numbered sections (1) – (4) are explained in the text. Note that in this example the AIOMFAC-web output for point no. 2 represents a metastable solution for two reasons: (i) the mole fraction-based activity of 2,5-Hexanediol, a_x(02), is greater than 1, which means that a phase separation would be stable for sure (as discussed above) and, less obvious, (ii) dissolved KCl is supersaturated with respect to its crystalline salt, as the molal ion activity product IAP = [a_m(K+)]1 × [a_m(Cl-)]1 is greater than the IAP of the saturated solution of KCl; IAPsat(KCl) = ~7.95 at 298 K, as determined from measurements of the solubility limit using AIOMFAC. Click here to display a larger version of this image.
The structure of the model output typically looks like the one shown in Fig. H2. The different sections on the output page, numbered in Fig. H2, are described in the following.
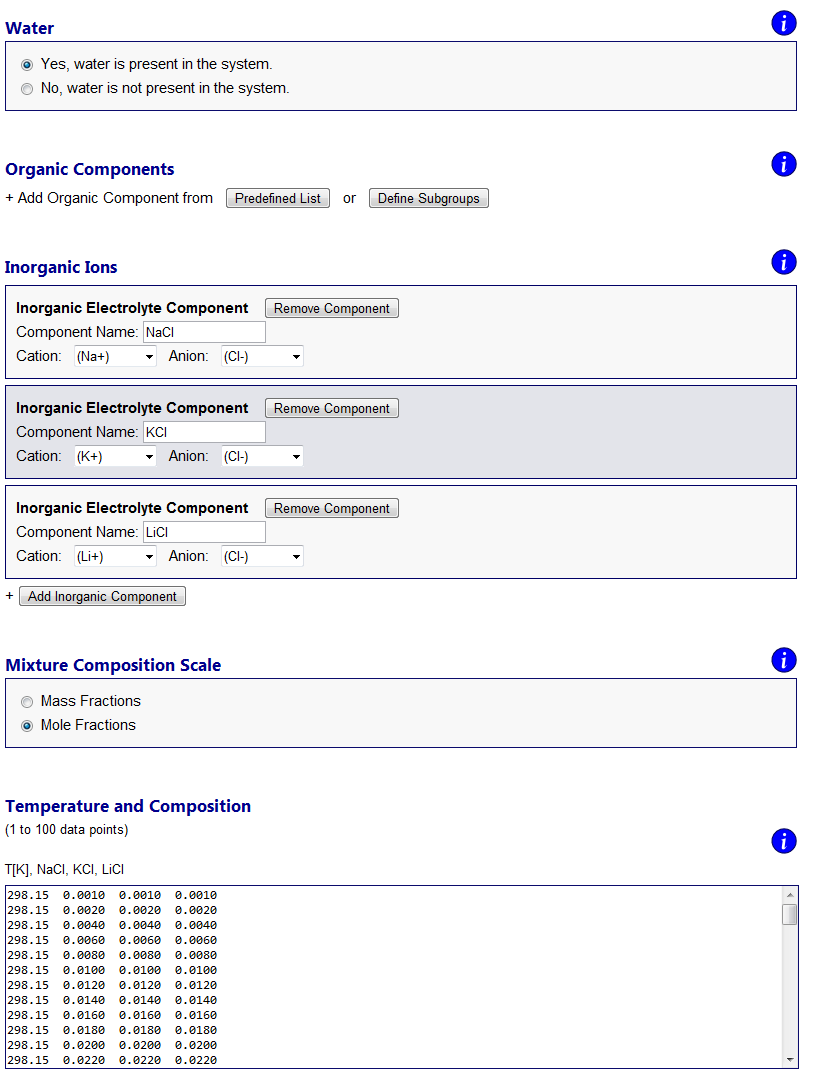
Errors and warnings ↑TopIf an error occurs due to invalid model input or numerical issues, an error message will be shown on top of the Results page. Error messages are designed to state a possible cause of the problem and indicate to the user what needs to be checked / changed on the input side. For example, if one tries to perform model calculations for a system containing certain organic main groups and inorganic ions which require interaction parameters that are not available (see About AIOMFAC, Fig. 4), an "AIOMFAC ERROR 1" message will be displayed and model execution canceled. Numerical issues that apply only to a subset of data points and do not constitute an overall error, are flagged with a non-zero error number in the model output tables. Warning notifications are shown in some cases when the input is technically valid, but caution is advised due to input data points outside of the recommended parameter range. For example, a warning message will be shown on the output page if the temperature of a data point is set as T < 288 K in case of an electrolyte-containing mixture. Data points affected by a warning message are flagged with the corresponding warning number. Examples ↑TopThe following examples demonstrate a selection of different kinds of questions that can be addressed using AIOMFAC-web. Example 1: Mean activity coefficients in aqueous electrolyte solutions ↑TopMeasurements of activity coefficients of individual ions in binary water + ion mixtures are impossible due to repulsive long-range electric charge interactions between ions of the same charge. Aqueous solutions of electrolytes therefore always contain both cations and anions in a balanced ratio to achieve electroneutral conditions on the macroscopic scale. This means that experiments can only provide a combined cations-anion non-ideality property of the dissolved electrolytes, which is typically evaluated as a mean activity coefficient based on ion molality and electrical charge of the ions. An overall neutral electrolyte unit can be expressed by the general chemical formula Mν+Xν-, with ν+ cations M of positive electrical charge and corresponding ν- anions X, e.g. NaCl (a 1:1 electrolyte with ν+ = ν- = 1) or (NH4)2SO4 (a 2:1 electrolyte with ν+ = 2 and ν- = 1) (Zuend et al., 2008). On molality-basis, the so-called mean molal activity coefficient is then defined as the geometric mean, γ±(m) = [γ+ν+ × γ-ν-]1/(ν+ + ν-); here the superscript (m) is often omitted as molality basis is almost always used. The use of mean molal activity coefficient data from electromotive force measurements, e.g., for the fit of AIOMFAC parameters, is discussed in Zuend et al. (2008; 2011). In contrast to experiments, models have no problem in defining and calculating individual activity coefficients of ions. This is also the case in AIOMFAC and the output page reports individual molal activity coefficients of the ions in a system. However, using the expression given above, γ±(m) is quickly calculated for an electrolyte of interest based on the model output. In Fig. H3., an example is shown for an aqueous solution of three electrolytes, the chlorides NaCl, KCl, and LiCl. The input file of this example can be downloaded from here and the corresponding input form is shown in Fig. H3.; the AIOMFAC-web output text-file is given here. The data points are stated in mole fractions (with respect to undissociated salts) and defined such as to keep a fixed 1:1:1 molar ratio of the three salts in solution. 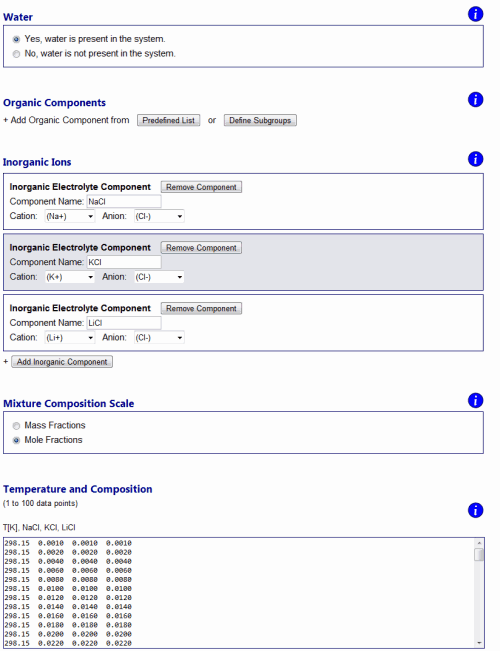
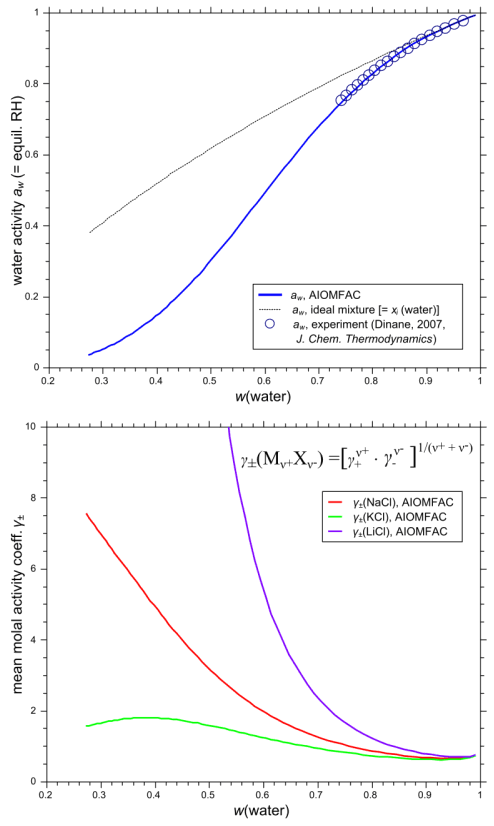
Fig. H3. Example 1 model input form and graphs of AIOMFAC-web results. An aqueous system of the three chlorides NaCl, KCl, and LiCl is entered with data points representing a fixed molar salt ratio of 1:1:1, covering total ionic strength from dilute to highly concentrated (supersaturated) conditions at 298.15 K (76 points entered in total). The result graphs show a comparison of calculated and measured water activity data plotted vs. mass fraction of water (upper panel). The deviation of this aqueous solution from ideal mixing behavior at higher electrolyte concentrations is evident from the comparison to the water activity curve of the corresponding ideal mixture. The lower panel shows the mean molal activity coefficients of the three different salts in the solution, all of which share Cl- as the common anion. Click to display a larger version of the input or of the result graphs.
The different curvatures of the mean molal activity coefficients of NaCl, KCl, and LiCl, shown in the lower panel of Fig. H3, represent the specific effects of different cations combined with the common anion Cl- in a solution. Li+ is the smallest of the three cations, with the highest surface charge density, K+ the largest one. As the solution approaches infinite dilution, where the mass fraction of water, w(water), is virtually 1.0, all mean molal activity coefficients approach the reference value of 1.0. The activity coefficient of water is influenced by the presence of the inorganic solutes and coupled to the ion activity coefficients via the Gibbs-Duhem relation. Dinane (2007, J. Chem. Thermodynamics 39, 96–103) has measured bulk water activities of this system in the concentration range subsaturated with respect to salt solubilities. These data are shown in Fig. H3 in comparison to the AIOMFAC-web data (these data were also part of the database used to fit AIOMFAC parameters). It is evident from Fig. H3 that the system deviates from an ideal mixture as the solution becomes more concentrated. The AIOMFAC-web curve shows excellent agreement with the experimental data and furthermore provides a reasonable description of water and salt activities from high to low relative humidity (low to high electrolyte concentration). Mean molal activity coefficients of electrolytes can also be measured in organic-inorganic mixtures and computed with AIOMFAC-web for any kind of system (in the applicable temperature range).
Example 2: Water content of an organic-inorganic mixture at given RH ↑TopAt atmospheric or lower pressures (~ ideal gas behavior), the laws of thermodynamics dictate that a liquid solution (bulk liquid, no curvature effect) in equilibrium with a gas phase (e.g., air) exhibits a water activity equivalent to the relative humidity (RH) in the gas phase. The water content of a solution changes when the RH changes. This is for example described by the hygroscopic growth behavior of water-soluble aerosol particles. The standard "forward" calculation mode of AIOMFAC is to compute activity coefficients as a function of temperature and solution composition. If we, however, want to calculate the water content of a mixture at a given RH and temperature (in equilibrium with that mixture), we need to solve for the mixture composition as a function of water activity. Since a change of mixture composition affects all activity coefficients in a non-linear manner, such a calculation requires an iterative approach. In general, this type of thermodynamic equilibrium problem can be solved with a gas–particle partitioning or vapor–liquid equilibrium model, such as the one of Zuend et al. (2010). However, a good estimate for a mixture's water content can also be obtained without a numerical iteration method, with just 1 to 3 "manual" iterations using AIOMFAC-web, as demonstrated in this example. Here we use a mixture consisting of the following seven components: water (1) + malic acid (2) + malonic acid (3) + maleic acid (4) + glutaric acid (5) + methylsuccinic acid (6) + (NH4)2SO4 (7), in which the organic acids and ammonium sulfate are present at a fixed molar mixing ratio of 1:1:1:1:1:1. The goal is to calculate the equilibrium water content of this organic-inorganic mixture at 298.15 K and 85 % RH. For this purpose, the following steps are carried out:
Example 3: Solubility limit and deliquescence relative humidity (DRH) ↑TopIn this example the calculation of the deliquescence relative humidity (DRH) of a salt (here ammonium sulfate) in an organic-inorganic mixture is demonstrated. The deliquescence relative humidity of aqueous solutions is thermodynamically related to the solubility limit (saturation concentration) of a compound in a solution and the corresponding state is the solid–liquid equilibrium (SLE), (see, e.g., Zuend et al., 2011). The 7-component system from Example 2 is used here and the focus is on the DRH of ammonium sulfate (AS). However, note that in multicomponent solutions, several compounds could potentially form solid, crystalline phases in equilibrium with a saturated solution (depending on the system temperature and the melting point of possible solids). Therefore, in general, there are also several DRH pertaining to the solubilities of the system components (or stoichiometrically fixed component mixtures in case of hydrates and mixed crystals) and the highest DRH defines the RH above which the entire mixture will be in the liquid state (but not necessarily as a single liquid phase). Since a crystal of AS holds a fixed stoichiometry expressed in its formula unit, (NH4)2SO4, the solid has also a fixed chemical potential, the value of which is mainly a function of temperature and, to a lesser extent, total pressure. Therefore, at a given temperature and atmospheric pressure, solid AS in equilibrium with a (saturated) liquid mixture exhibits a specific molal ion activity product (IAP) in that solution, no matter what the other components of the mixture are. However, the mass or mole fraction of the saturated component in solution is affected by the other mixture components. Experimental data on the solubility of salts in (pure) water is often available, while this is most often not the case for the solubility in multicomponent organic-inorganic systems. Here models like AIOMFAC offer a practical way to overcome this lack of experimental data. We can use the thermodynamic relations mentioned above to calculate the DRH of AS in a multicomponent system based on information of the solubility in a binary aqueous AS system. The procedure for that is described below:
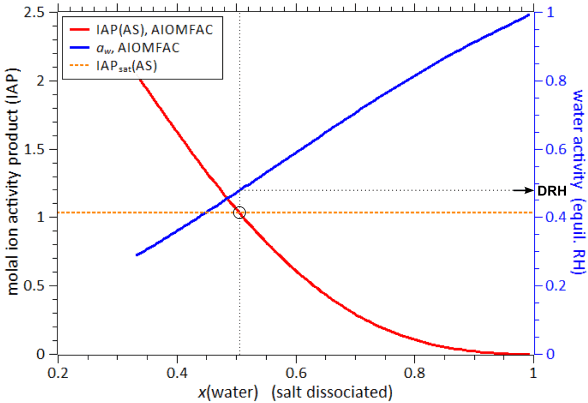
Fig. H4. Example 3 output graphs of the AIOMFAC-web results. Shown are the IAP and water activity of the system water + malic acid + malonic acid + maleic acid + glutaric acid + methylsuccinic acid + (NH4)2SO4 at 298 K, corresponding to the model output described in the text (output file). The x-axis represents mole fraction of water in the mixture, as defined on the basis of completely dissociated ammonium sulfate, i.e., x_i(01). The dashed orange line shows the IAP of ammonium sulfate (AS) at the solubility limit, as derived from the AIOMFAC-web calculation of the saturated binary aqueous AS system at the same temperature. The black circle indicates the point where AS in this 7-component system is saturated and the corresponding deliquescence relative humidity (DRH), ~ 48 % RH, is found using the blue water activity curve (right y-axis).
The resulting DRH(AS) value of the 7-component system is with ~ 48 % RH much lower than the one of AS in pure water (~ 80 % RH). Having other soluble species in a multicomponent mixture typically lowers the DRH of a salt. In this example the change in DRH is quite dramatic due to the rather high polarity and hydrophilicity of most of the dicarboxylic acids present in the system, which affect water activity and the solubility of ammonium sulfate. For more extensive (offline) calculations, a numerical algorithm can be used. When the solubility limit of a compound in a binary system (e.g. aqueous solution) is known, the solubilities and deliquescence relative humidities in different mixtures can be computed efficiently to high numerical precision using an iterative solid–liquid equilibrium algorithm based on AIOMFAC, as described and applied by Zuend et al. (2011). Browser compatibility and technical issues ↑TopAll pages of the website have been checked with the HTML and CSS standard compliance validators (http://validator.w3.org/) of the World Wide Web Consortium (W3C) and all passed the test.
This suggests that your web browser should not have any troubles rendering the HTML pages. For the interactive input forms and the dynamically generated model output, JavaScript is required and hence should be enabled on this website (usually the default). Technical issuesIf you find broken links or run into other technical issues (404 error pages etc.), we would appreciate if you report the problem to the webmaster stating time of access, encountered error, and additional information about the problem. |
| © 2012–2026 Andreas Zuend, California Institute of Technology | McGill University last page update: 2025-10-19 |
| Home | Disclaimer | Citation | About | Credits | Contact |
